Three weeks after you shipped the support bot, a customer asks about swapping a pair of shoes for a bigger size. The bot answers from your returns policy. Confident. Wrong.
You check the dashboards. Green. Latency normal, error rate flat, uptime at four nines.
You check the eval from part two. Still 97%.
But that 97% is from launch day. It scored ten questions you wrote yourself, against a knowledge base nobody has touched since. It says nothing about the question that customer just typed.
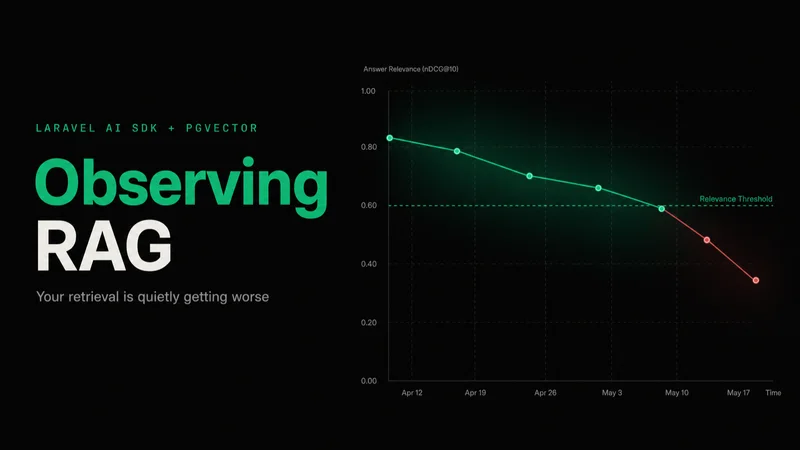
Your retrieval is getting worse, and nothing in your stack is built to notice.
The series built a RAG pipeline on pgvector and the Laravel AI SDK, then measured it and reranked it. Every one of those checks ran offline, against a golden set, before you shipped. This post is the other half: watching retrieval on live traffic, where there are no labels and no test to fail.
Your stack watches everything except the thing that broke
Point Laravel Telescope at the request and you see the HTTP call to OpenAI. Status 200, a few hundred milliseconds, a blob of JSON. Pulse tells you the same call was a little slow. Your error tracker says nothing at all, because nothing threw.
A wrong answer and a right answer are the same shape. Both are a 200. Both cost tokens. Both come back fluent.
So the tooling you already trust is blind here by construction. It was built for a world where broken means an exception, and healthy means green. RAG breaks while staying green.
And the worst part is what your own code does with the evidence.
Here is the tool the support agent calls to search the knowledge base. This is the version from part one, running in production right now:
public function handle(Request $request): Stringable|string
{
    $chunks = app(KnowledgeBaseRetriever::class)->retrieve($request['query']);

    if ($chunks->isEmpty()) {
        return 'No relevant policy information was found.';
    }

    return $chunks
        ->map(fn ($chunk) => "[{$chunk->source}]\n{$chunk->content}")
        ->implode("\n\n---\n\n");
}
Look at what leaves the room. The retriever computed a cosine similarity for every chunk, 1 - (embedding <=> query), one number that says how close each match was. Then it mapped the chunks to strings and threw the number away.
The model never sees it. You never see it. The single most useful signal about whether retrieval worked gets computed on every request and dropped on the floor.
Keep the score
You do not need a new vendor to fix this. You need a table and a decorator.
The table is one row per query. What was asked, what came back, and the numbers the tool used to throw out:
Schema::create('rag_traces', function (Blueprint $table) {
    $table->id();
    $table->text('query');
    $table->json('retrieved');            // per-chunk source, similarity, rank
    $table->double('top_similarity');
    $table->double('mean_similarity');
    $table->double('min_similarity');
    $table->double('embed_ms');
    $table->double('search_ms');
    // filled in later, once the model answers:
    $table->text('answer')->nullable();
    $table->unsignedInteger('input_tokens')->nullable();
    $table->double('cost_usd')->nullable();
    $table->unsignedTinyInteger('judge_score')->nullable();
    $table->timestamps();
});
The decorator wraps the retriever you already have. Same retrieve(string, ?int) signature, so it drops into the tool with a one-line change. On the way through it times the embed and the search on their own, keeps the similarity scores, and writes the row:
class TracedRetriever
{
    public function __construct(
        private Embedder $embedder,
        private KnowledgeBaseRetriever $retriever,
        private TraceContext $context,
    ) {}

    public function retrieve(string $query, ?int $k = null): Collection
    {
        $k ??= config('knowledge.retrieval_k');

        $embedStart = hrtime(true);
        $vector = $this->embedder->toVector($this->embedder->one($query));
        $embedMs = (hrtime(true) - $embedStart) / 1e6;

        $searchStart = hrtime(true);
        $chunks = $this->retriever->search($vector, $k);
        $searchMs = (hrtime(true) - $searchStart) / 1e6;

        $this->record($query, $chunks, $embedMs, $searchMs);

        return $chunks;
    }
}
Swap app(KnowledgeBaseRetriever::class) for app(TracedRetriever::class) in the tool and every live request now leaves a trace. Here is a real one, the shoes question:
{
  "query": "These shoes are too small, can I get the next size up without paying again?",
  "top_similarity": 0.4144,
  "retrieved": [
    { "source": "exchanges.md", "similarity": 0.4144, "rank": 0 },
    { "source": "returns-policy.md", "similarity": 0.3662, "rank": 1 },
    { "source": "damaged-or-defective.md", "similarity": 0.3327, "rank": 2 }
  ],
  "embed_ms": 519.82,
  "search_ms": 1.11
}
Two things jump out of that row before you do any analysis.
The embed took 520 milliseconds. The pgvector search took one. The API call to turn the query into a vector is 99.8% of your retrieval time, and the nearest-neighbour search you were worried about is noise. A single “retrieval latency” number would have hidden that. Split the stages and it tells you exactly where to cache.
The second thing is the scores. And that is where the real signal lives.
A signal that needs no labels
Here is the honest part most observability posts skip.
Absolute similarity does not tell a right answer from a wrong one. On this knowledge base, the questions the bot gets right have a mean top-1 similarity of 0.52. The ones it gets wrong sit at 0.49. That gap is noise. Every support document is broadly about support, so a wrong-but-adjacent chunk scores nearly as high as the correct one. Do not build an alarm on it.
What the score does tell you, cleanly, is whether the corpus can answer the question at all.
I ran 42 real support questions and 10 questions the knowledge base has no business answering: weather, tax filing, the capital of New Zealand. The split is not subtle:
                      mean top-1 similarity   lowest / highest
in-domain (42)                0.513            lowest  0.322
out-of-domain (10)            0.136            highest 0.251
The lowest score any real question earned is 0.322. The highest any out-of-domain question reached is 0.251. They do not overlap. One threshold around 0.29 separates every answerable question from every unanswerable one.
That matters because of what the agent does with a question it cannot answer. It answers anyway.
{
  "query": "What's the capital of New Zealand?",
  "top_similarity": 0.073,
  "retrieved": [
    { "source": "shipping-policy.md", "similarity": 0.073, "rank": 0 }
  ]
}
Retrieval returned your shipping policy for a geography question, at 0.07, and the request came back 200 OK. Without the score, that is invisible. With it, you have a floor: anything under 0.29 is a query the corpus never covered, flagged before the model gets a chance to invent something. Alert on the rate of those and you find the gaps in your knowledge base by reading what your customers actually ask.
No golden labels. No test. Just a number you were already computing.
Watch it drift
The other thing a stored score buys you is time travel. You can compare today to last week.
Say a teammate wants to cut the embedding bill. Fewer, bigger chunks means fewer embedding calls, so they re-ingest with a larger chunk size and ship it. The build passes. Nothing errors. The knowledge base still has all nine documents.
Run a probe over your question set before and after:
php artisan kb:probe --set=support-questions.json
# mean top-1 similarity 0.543   (chunk size 600)

# ... re-ingest with --chunk-size=2000 ...

php artisan kb:probe --set=support-questions.json
# mean top-1 similarity 0.464   (chunk size 2000)
Retrieval confidence dropped 15% from one config change. Every chunk now carries more text, so the vector is an average over more content, so it sits further from any specific question. The answers get vaguer. No exception fires. No offline eval catches it unless you happened to write a golden question for the exact topic that regressed.
The kb:probe command is a short loop: run a set of questions through the traced retriever, average the top-1 similarity, print it. Run it after any change that touches the index and you see the regression the same day, not three weeks later in a support ticket.
Tokens and cost on the same row
Retrieval is half the request. The other half is the model, and the Laravel AI SDK gives you a clean place to instrument it.
The SDK runs your agent through a middleware pipeline. A middleware wraps the whole prompt-to-response cycle, so you get the answer, the token usage, and the model id in one place:
class TraceGeneration
{
    public function __construct(private TraceContext $context) {}

    public function handle(AgentPrompt $prompt, Closure $next)
    {
        $this->context->clear();

        return $next($prompt)->then(function (AgentResponse $response) {
            RagTrace::find($this->context->id())?->update([
                'answer' => $response->text,
                'input_tokens' => $response->usage->promptTokens,
                'output_tokens' => $response->usage->completionTokens,
                'cost_usd' => TokenCost::usd($response->meta->model, $response->usage),
            ]);
        });
    }
}
Register it on the agent with middleware(): array { return [app(TraceGeneration::class)]; } and every answer records its own cost.
One detail earns its keep. The retrieval trace is written deep inside the tool call. This middleware fires after the whole run finishes. They never call each other, so a request-scoped TraceContext singleton carries the row id from one to the other: the middleware clears it at the start, the tool sets it when it writes the retrieval row, the middleware reads it when the answer comes back. That is how retrieval and generation land on the same line.
There is no cost field in the response. There is no cost field in the OpenTelemetry conventions either. You compute it from tokens and your own rate card:
public static function usd(string $model, Usage $usage): float
{
    $rate = config('observability.pricing')[$model]
        ?? config('observability.pricing')['default'];

    return round(
        $usage->promptTokens / 1_000_000 * $rate['input']
        + $usage->completionTokens / 1_000_000 * $rate['output'],
        6,
    );
}
Across the ten hard questions, each answer averaged 740 input tokens and 100 output tokens. The tokens are measured and real. The dollar figure is only as honest as the rate you put in the config, so put your model’s real numbers there. Now cost lives on the same row as similarity, and a query that quietly balloons to 4,000 input tokens because retrieval stuffed the context stops being a line item you find at month end.
Judge the answer you can’t see
Retrieval can be perfect and the answer can still drift from it. So score the answer too.
Offline, you judge against a policy document you wrote in advance. Production has no such document. What it has is the context the model was actually handed, which is enough for a reference-free faithfulness check: did the answer stay inside the chunks it was given?
Run it in a queued job, on a sample, off the request path:
class EvaluateRagTrace implements ShouldQueue
{
    use Queueable;

    public function __construct(public int $traceId) {}

    public function handle(): void
    {
        $trace = RagTrace::find($this->traceId);

        $context = collect($trace->retrieved)
            ->map(fn ($chunk) => "[{$chunk['source']}]\n{$chunk['content']}")
            ->implode("\n\n---\n\n");

        $verdict = (new ResponseJudge)->prompt(<<<PROMPT
            Question: {$trace->query}

            Retrieved context (the only source of truth the agent was given):
            {$context}

            Support agent reply:
            {$trace->answer}
            PROMPT);

        $trace->update(['judge_score' => $verdict['score']]);
    }
}
Sample it in the generation middleware so the customer never waits on the judge:
if (mt_rand() / mt_getrandmax() <= config('observability.judge_sample_rate')) {
    EvaluateRagTrace::dispatch($trace->id)->afterResponse();
}
Across every sampled answer, the judge scored a clean 10 out of 10 for faithfulness. That is a green result, and green is the point. You are not looking for a number that says the bot is broken today. You are building the one signal that tells you the day it stops being 10 out of 10, on traffic you never wrote a test for.
One request, one row
Four moving parts, one row. The retriever writes the retrieval half and stamps its id into TraceContext. The middleware reads that id when the answer comes back and fills the generation half onto the same row. A sampled job adds the score last.
flowchart TD
    Q["Customer question"] --> A["SupportAgent<br/>(wrapped by TraceGeneration middleware)"]
    A -->|calls tool| T["SearchKnowledgeBase"]
    T --> R["TracedRetriever"]
    R --> E["embed query"]
    R --> S["pgvector search"]
    E -->|"embed_ms"| ROW[("rag_traces row")]
    S -->|"similarity, ranks, search_ms"| ROW
    A -->|"answer, tokens, cost_usd"| ROW
    ROW -->|"sampled, 1 in 10"| J["EvaluateRagTrace queued job<br/>judge_score"]
Read it top to bottom and it is one customer question turning into one durable record of what your RAG system actually did.
What you can now see
You started blind. A wrong answer looked exactly like a right one, and the only alarm was a customer complaint.
Now every request leaves a row. You watch top-1 similarity and catch the day retrieval drifts. You floor it at 0.29 and catch the questions your corpus can’t answer before the model bluffs. You read cost per query off the same line, and you score a sample of answers for faithfulness on live traffic instead of hoping.
When the table outgrows you, the escape hatches are there. A proxy like Cloudflare AI Gateway or Helicone gives you logs and cost for a one-line base-url change. The axyr/laravel-langfuse package auto-instruments the AI SDK if you want a real trace UI. Any OpenTelemetry backend takes the same spans through keepsuit/laravel-opentelemetry. Reach for them when a Postgres table stops being enough, not before.
The whole thing is on GitHub at MujahidAbbas/laravel-rag-evals. The trace table, the decorator, the middleware, and the probe command are all in it. Clone it, point it at your own knowledge base, and watch the number your retrieval has been hiding.